Blackline Safety is excited to introduce a new and improved version of our previous incident report. This new gas readings report will plot gas readings over time and show where each reading occurred on a fully interactive map. There are four parts to this report: the sensor readings report, TWA readings report, STEL readings report and gas logs. Each report will offer you different insights in different formats related to gas readings recorded by G7’s in your device fleet.
These reports should be filtered down to a single device at a time, since setpoints and sensor settings can differ between devices.
Gas sensor readings
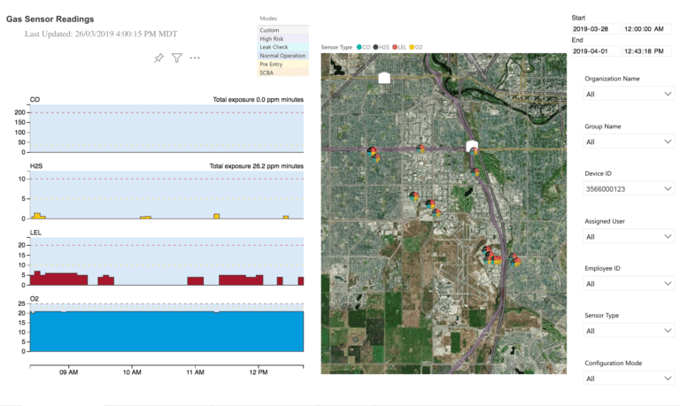
The gas sensor readings report provides you information on gas incidents that occurred on a particular device — you can see when gas readings are occurring and whether they passed the device’s low or high threshold and resulted in a gas event. You can also see on the map where the device is getting these readings, and use this information to pinpoint areas that have hazardous gases.
Hovering over the area chart on the left will show you all of the sensor readings at that point in time. You can also click any of the points on the map to focus the area chart to that particular reading. Additionally, each section of the area chart summarizes the total gas exposure per sensor over the selected amount of time. It is easy to see at a glance whether a user is being exposed to hazardous amounts of gas over an extended period of time.
Lastly, you can tell what mode a device was in at the time of each gas reading based on the colour in the background of the area chart. Since different modes can cause the device to react differently to gas, it can be important to know what mode a device is in when investigating a gas event.
Brush filter
June 2019 update
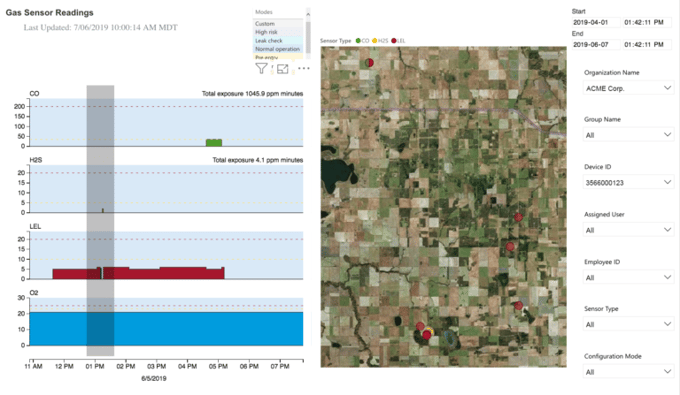
In the new update of the gas sensor readings report, you are able to click and drag across a section of the area graph to focus the area chart and the maps visual to the points within that selected range. This feature will make it easier to select a particular range of points that shows valuable information, rather than manually adjusting the time and date filters.
To unselect the brush-selected area, simply click within the visual. The visual will reset to the original date and time range.
TWA and STEL reading reports
The TWA and STEL reports are similar to the sensor readings report. They track gas readings and gas exposures over a selected amount of time, and show on the map where these readings are occuring. However, since TWA and STEL are based on rolling calculations, the total exposure has been omitted.
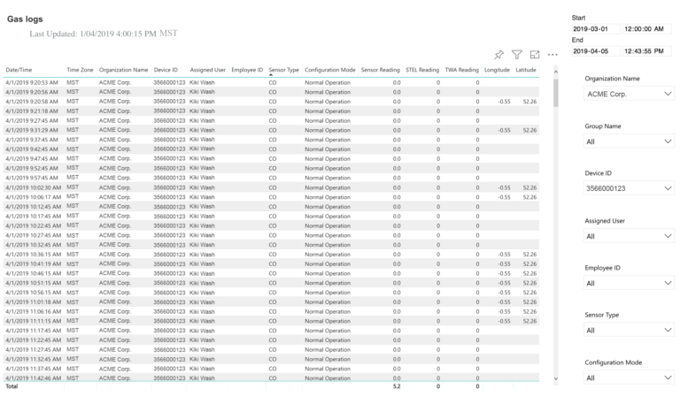
Gas logs
The gas logs report shows all of a device’s gas readings in tabular format, so that they can easily be sorted, filtered and exported.