This page was released Monday November 18.
After much feedback from monitoring centres who use our system — including our own Safety Operations Centre — we are very pleased to introduce you to our new alerts page. This page will combine the functionality of the current alerts management and alert history pages by listing both active and historic alerts in one list.
The main menu will be changed with this update — the alerts management and alert history links will be replaced by a single alerts link.
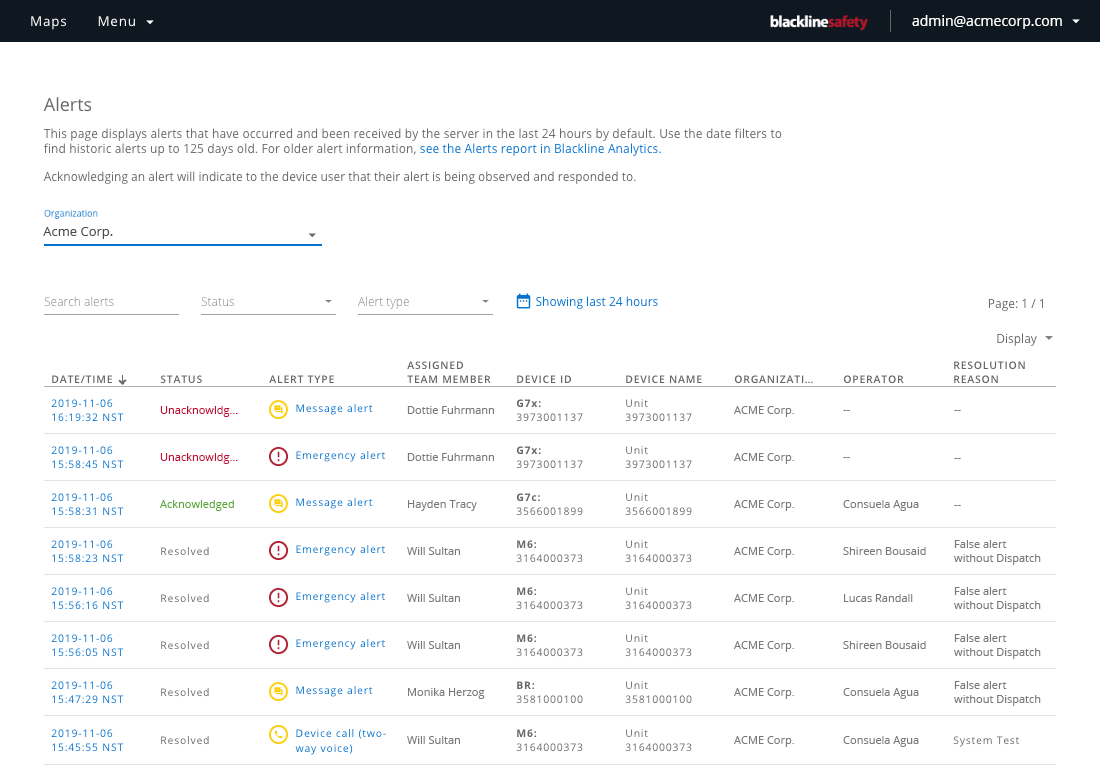
This page will list alerts in the same format as our devices or team members table, meaning alerts will now be searchable, sortable and paginated. These features will make it easier than ever to search for specific alerts by the assigned team member or device information.
Sorting
To sort by a specific column, simply click on the column header. By default, the table will sort by date/time so that alerts are listed in chronological order, with the most recent alerts showing up at the top. For monitoring centres, it may also be beneficial to sort by status so that active alerts appear above resolved alerts in the list.
Filters
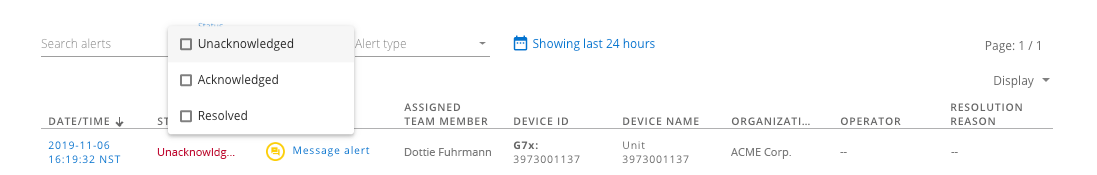
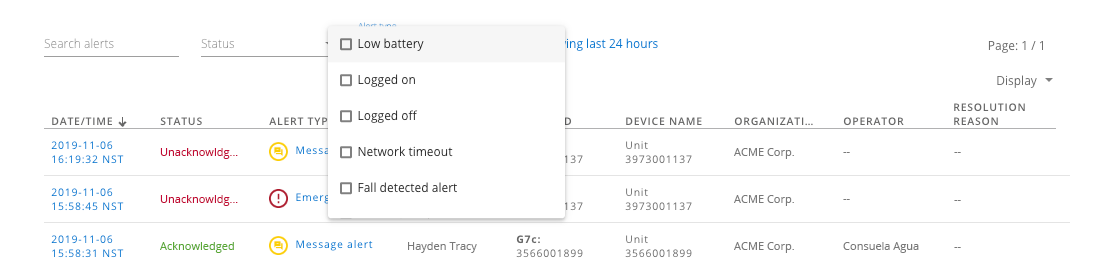
In addition, we have made filters available to show alerts you care about and hide others you don’t need. For example, monitoring centres may want to filter by status in order to only see active alerts, whereas another user looking for a specific historic alert may want to filter by alert type or date and time to narrow down their search.
Date and time filter
The date and time filter on the alerts page is unlike any other date filter we have used before. You will see a blue text button above the alerts list that indicates the current state of the date/time filter. By default, this filter will be showing the last 24 hours. This default setting is ideal for monitoring services who need to see alerts in real-time as they come into the portal.
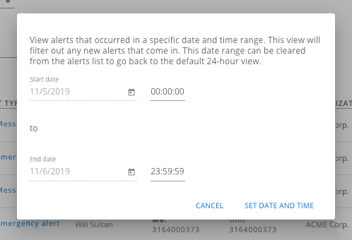
If you would like to filter to a specific date range to find a historic alert, simply click on this blue text to open the date and time filters in a pop-up modal. From here, you will be able to select a start and end date and time.
Once a range has been selected, the dates will be displayed in the button text. To edit the filter, simply click on the text to open the modal again. To clear the filter and go back to seeing the last 24 hours, click the red clear date range button.
Operator
A new piece of information in the alerts list is the “operator” field. This is the account user that last took action on an alert. This means that for an acknowledged alert, the operator was the user that acknowledged it, and for a resolved alert, the operator was the user that resolved it. This allows greater visibility on who on a monitoring team is taking ownership over alerts, and who the best point of contact is when it comes to inquiries about certain alerts.
Viewing alerts
To view an alert, simply click the timestamp or the type of alert. If this alert has an active status — unacknowledged or acknowledged — you will be redirected to the alert management page. This is the page monitoring agents use to review the status of the device, see the emergency response protocol, and contact the user’s emergency contacts. There have been no changes to this page.
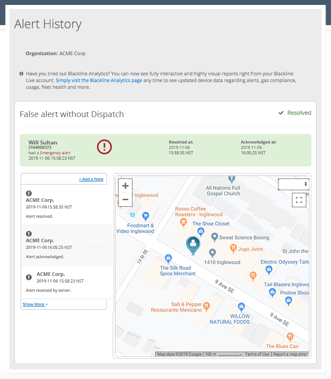
If the alert is resolved, you will be redirected to the alert history page. You will notice that this page looks slightly different than previously — it only shows one alert instance, and no longer features a sidebar that lists other alerts. This is because the content of this sidebar is now populated as part of the new alerts list.
If you have questions about the new alerts page, please contact our Customer Care team.


