Edited February 11, 2019
Blackline Safety prides itself on providing customers with frequently updated data from their device fleet in the form of comprehensive analytics and reports. Customers can use this data to review their fleet’s maintenance, usage, compliance, event frequency, alert response time and more.
With the release of our new Blackline Analytics product, getting this information will become even easier. Blackline Analytics is built directly into the Blackline Live portal, so that anyone with login access will be able to see their own organization’s data, as well as client data. Furthermore, if users have only been given access to specific groups of devices, they will only see data attached to those particular devices.
How to access Blackline Analytics
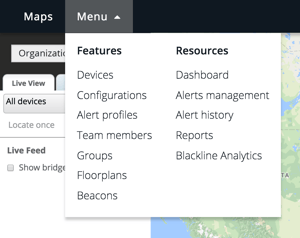
Blackline Analytics is built into the Blackline Live portal. Log in to your organization using your account log-in credentials, and click the main menu dropdown to find the Blackline Analytics link under resources
Reports
Blackline is offering five reports upon the release of Blackline Analytics. Each report takes data from your device fleet and transforms it into comprehensive maps, graphs and tables.
Events report
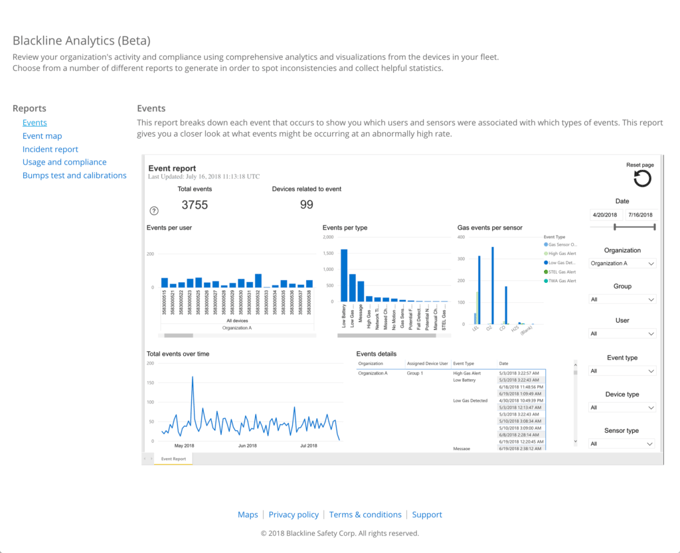
The events report gives an overview of all event types occurring in the device fleet. The user can filter these events down to see them by user, group, organization, event type or gas sensor type. This report will also show event trends over time so that managers can track improvements in their processes.
Events map report
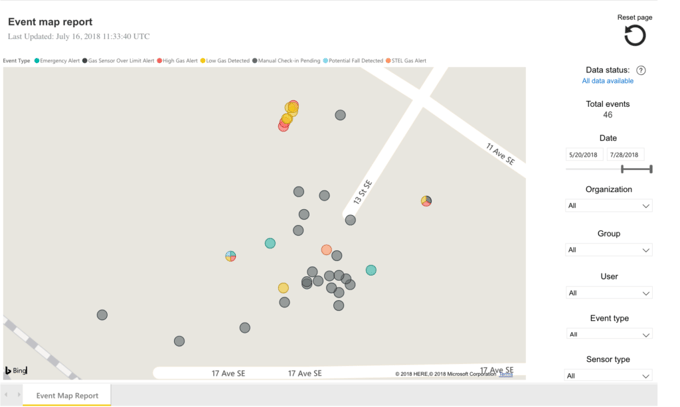
The events map directly compliments the events report, and shows where events have occurred on a map. Hovering over a point on the map will indicate the event type and its exact location. This report can be used to observe clusters of points where events of a certain type may be occurring more frequently.
Alerts report
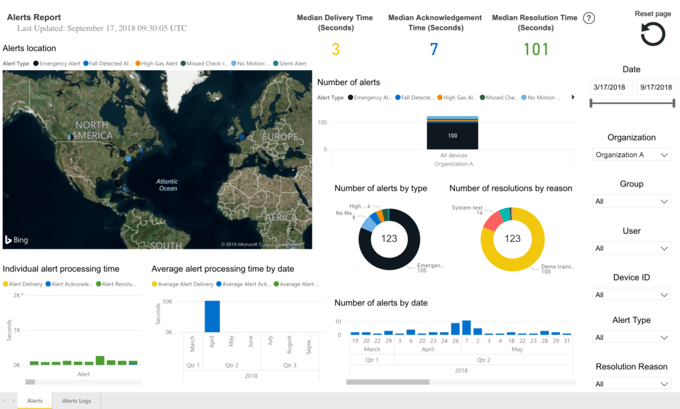
This report delivers a full breakdown of alerts occurring on devices. See which device user is triggering the most alerts, when and where alerts are occurring and what types of alerts of most common. Additionally, if you are using our real-time monitoring services you can see the time it takes for alerts to be resolved, resolution trends and the most common resolution reasons. The second tab of this report, titled "Alert logs", gives alert data in tabular format for easy export.
Incident report
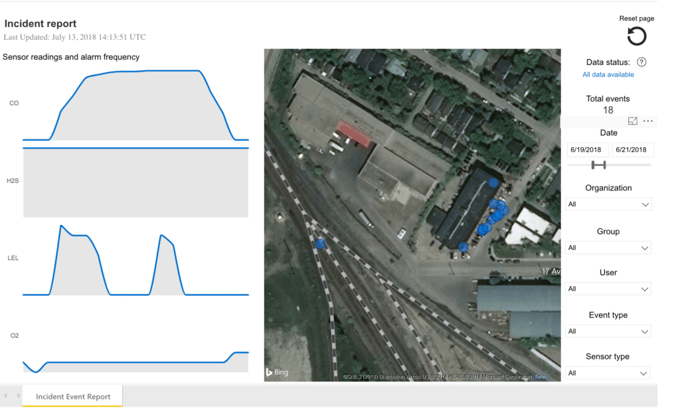
The incident report is best used to examine a particular incident that occurred at a specific point in time. Users can see events mapped side by side over time for easy comparison, and can also see where each of these events occurred on a map. These graphs will help to determine the chronological order of events that occurred during an incident, and whether they may have been related.
Usage and compliance report
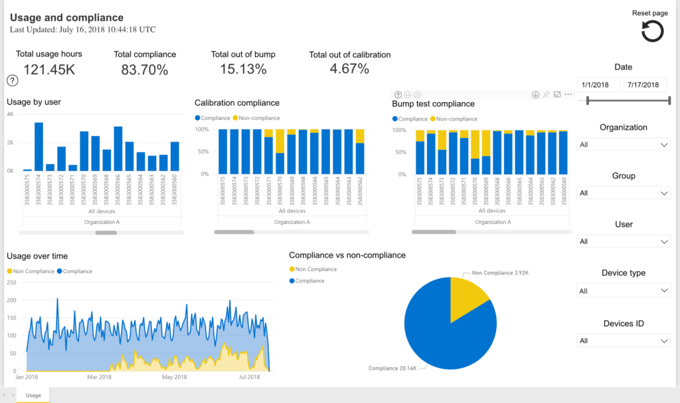
The usage and compliance report will show total device usage per user, group or organization. It will also show what percentage of this usage was done while the device was compliant, as well as trending usage and compliance over time. You can use this report to review how your team members use their devices, and to track changes in their usage over time.
Bump test & calibration report
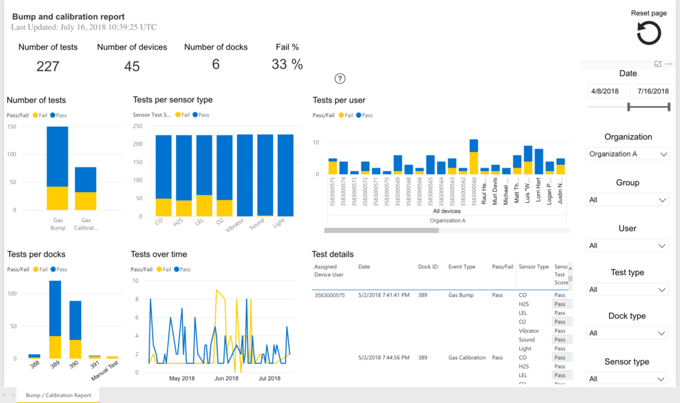
The bump test and calibration report will show how many bump tests and calibrations are performed on your device fleet, how many of these tests were successful and whether the tests were performed manually or with a dock. Additionally, this report shows an overview of each gas sensor and hardware test, so that you can easily pinpoint which parts of the device are working correctly.
Asset utilization — Location beacons![]()
The beacons report communicates the status and effectiveness of your Location Beacons — you can use this report to monitor battery levels and ensure locations are being delivered frequently and consistently.
Asset utilization — Devices and cartridges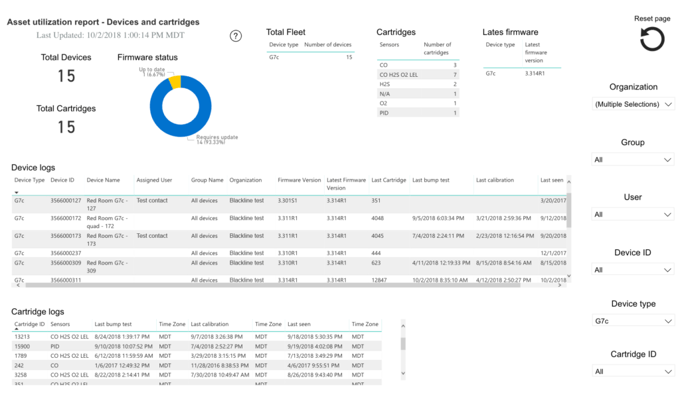
This report gives a full overview of the status of your devices, including their firmware version and when they last communicated with the Blackline Safety Network. You can use these logs to stay on top of firmware updates and ensure your devices and device cartridges are being used and maintained regularly.
Asset utilization — Docks
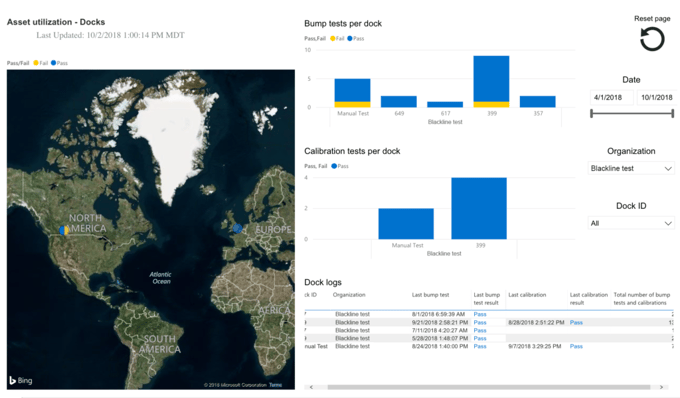
Docks can automatically charge, bump test and calibrate G7 devices, making them valuable assets when striving for efficiency and compliance. This report delivers information on the locations and usage of G7 Docks. Use the map to see where a dock was last used, and track each dock's bump test and calibration results to track performance and ensure regular maintenance.
Device logs
.png?width=680&height=410&name=Table_edited-1024x618%20(1).png)
The device logs report give a full breakdown of all of the information received by a device in any event. This report can be useful in investigating a particular event and gathering all relevant information collected by the device. It can also be used to export data for your own analysis and visualizations. To learn more about the device logs report, see this support article.
Device assignment history
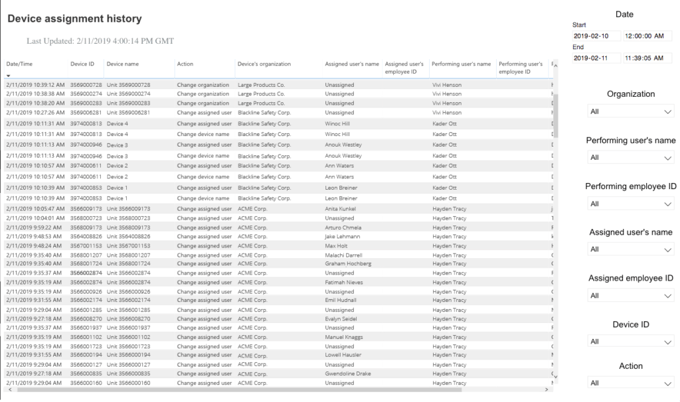
The device assignment history report gives a full breakdown of specific actions applied to a device in order to keep track of your fleet and create accountability. The primary use of this report is to track device assignments, but can also be used to see when devices are moved between organizations or when a device's name is changed. Similar to the device logs report, the data from this table can be exported for your own analytics or visualizations. See this support article on how to export data.
Tools and features
Report filters
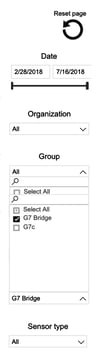
Each report includes a number of filters to narrow the focus of your reports. You can choose to filter by organization, group, user, device, event type, date and time, and many others. The filters appear on the far right of every report — simply open one of the dropdowns to view the available options and click on the options you want to see. To select several options, hold the CTRL button on Windows, or Command on Mac while clicking each desired filter.
Additionally, you can focus and filter the report by clicking on a piece of data from any of the report graphs. For example, when viewing the events report, you can click on a specific user’s data in the “events per user” graph, and the rest of the report will change to only show data associated with that user. Once again, you can hold CTRL or Command to select multiple resources. Click the resources again to turn off the filter and return the report to normal.
If you would like to reset the filter and return them to the default mode, click the reset page button in the top right corner of each report.
Tooltips
If you see a question mark icon, you can hover with your mouse to see additional information and helpful tips about different features.
Drill up and drill down functions
![]()
Many of the graphs feature drill up and drill down features, which allows you to see data at an organization-level, group-level or user-level. If you hover over one of the graphs in the report and see three icons appear in the top left, this indicates that the graph supports the drill up and down features. By default, these tables are drilled down to users, but pressing the icon pointing up will take your view to the group-level, and then organization-level. You can use this feature to easily compare groups of users or individuals.
Focus mode and Show data
.png?width=680&height=428&name=focus-mode-1024x644%20(1).png)
Each report graph can be viewed in “focus mode”, which is an alternate screen view that shows a selected graph at a larger scale. In order to open focus mode, hover over a graph until you see icons appear in the top right corner. Click the full-screen icon to the left of the three dots to open focus mode and see the graph in higher resolution and more detail.
.png?width=680&height=372&name=Show-data-1024x560%20(1).png)
Similarly, you can view each graph alongside the tabular data it represents by clicking the three dot icon and selecting “Show data” from the dropdown menu. This open a view that is similar to focus mode, but will also display the data that the graph is representing.
Printing and exporting data
As the reports are built right into Blackline Live, it is easy to print these reports from the browser itself. For an even better image, you can open focus mode or select “show data” before printing.
Feedback and continued improvement
Are you having a hard time finding information that would help you better understand your organization’s trends and progress? Do you think our reports could be improved with a new graph or filter? In order to constantly improve Blackline Analytics and our portal as a whole, we welcome you to send your feedback to suggestions@blacklinesafety.com.


