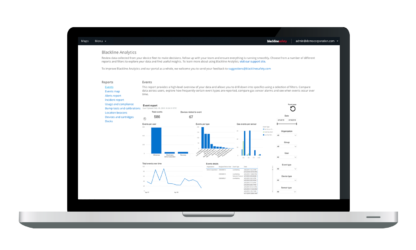
You can access interactive reports in Blackline Live by selecting Menu > Resources > Blackline Analytics.

Blackline Analytics offers a comprehensive look at data being collected by your device fleet. This feature is included with Blackline service and can be accessed by anyone with log-in access to the Blackline Live web portal. Blackline Analytics leverages Microsoft’s Power BI platform, which allows for a highly interactive experience and the ability to investigate data on a granular level.
Reports group together similar data to hone in on a specific topic — this helps to keep each report focused, and allows customers to personalize their organization’s report list based on the kind of data they are interested in seeing.
The insights gained from Blackline Analytics can help to review and test the efficiency of processes, track productivity and compliance, monitor fleet health and investigate incidences that occur on-site.
You can access interactive reports in Blackline Live by selecting Menu > Resources > Blackline Analytics.
Each Blackline analytics report now has an About section that includes the Data History window for the report.
Accurate data preparation and processing takes time—on average it takes approximately 4 – 5 hours for an event to show on a report.
No. The data (the device logs) from your fleet is retained for the life of our relationship with you. The reports show the analysis of the data presented to you in easy-to-navigate charts, graphs, and tables with actionable information, and have a rolling Data History window.
Hover over the visual you would like to see, and select the maximize icon that appears second to the top-right. This brings that particular visual into focus — select the back to report button to go back.
Exporting data from the three dots icon of a particular visual will only export data for that visual. You cannot export data for multiple visuals at once.
Select the three dots icon and hover over the sort by… option. The available sorting options will appear in another dropdown menu.
By default, Blackline Analytics reports compare data between users. By drilling up within a visualization, you are able to compare data between groups and organizations. The same can be done when comparing time — you can drill up and down between days, months, quarters and years if the data exists.
In order to drill down, hover over a visual and select the arrow icons to drill up and down.
When comparing data, keep in mind that users or devices may be duplicated in the data if they exist in multiple groups
Click on the first bar, and then hold ctrl (command on mac) and click the second bar. This will focus the report based on the two resources you selected.
This applies to any resource you see in the report as well, not just bars in bar charts.
In general compliance describes whether company or industry standards are being followed. In the context of Blackline Analytics, gas compliance refers to frequency that a device is bump tested and calibrated.
Gas compliance in reports is based on the configured bump test and calibration intervals defined in a device’s configuration profile.
Charts typically group team members by their respective groups by default. Because devices and assigned team members can have activity in multiple groups, it is likely that they will show up multiple times in a chart
Oftentimes, charts will list assigned users on the x-axis. In the case that a device is unassigned, its unit ID will be listed instead.
The security is based on your account email, and what groups you are allowed to see. If you have been given access to a specific group, you will see data for devices in that group. If at a later time, your access gets revoked, you will no longer be able to see devices in that group.
If your organization has a relationship to another organization, you will not be able to see devices in that client organization by default. You will need to be added as a group manager to one or more of the client’s groups — once you have this access, you will be able to see data from device in these groups.
The connection between an assigned team member and a device does not affect what they can see. Visibility of device data is based on what groups/org the device belongs to, and what groups/orgs a user can see.
Different reports show different truths based on the information that is being shown. For example, the usage and compliance report is based on assigned team members, while the asset utilization reports are based on the devices themselves.


| Blackline Analytics Essentials Reports FAQ |


| Blackline Analytics Technical User Manual_R1 - EN | |
| Blackline Analytics Technical User Manual_R1 - FR |